
Slovak real-estate market overview & monitoring

Slovak real-estate base market overview & monitoring

This digital product is a comprehensive market overview of the Slovak real estate sector, meticulously curated from data extracted from various public sources available on the internet. This innovative platform presents an interactive dashboard featuring an array of charts, plots, diagrams, and tables. Updated on a weekly basis, it serves as a valuable monitoring tool for professionals within the real estate industry, offering detailed insights into market trends, current property prices across different types, and a holistic view of the dynamic landscape. It's designed to empower users with up-to-date information crucial for informed decision-making and staying ahead in the competitive real estate market.

Comprehensive Insights

Gain a comprehensive understanding of the Slovak real estate market with detailed insights into pricing trends, property types, and regional dynamics, enabling informed decision-making.

Professional Monitoring Tool

Ideal for industry professionals, this dashboard serves as a powerful monitoring tool, providing a holistic view of market fluctuations and enabling proactive responses to changing trends.

Strategic Decision Support

Empower your strategies with data-driven insights, helping to identify opportunities, anticipate market shifts, and make well-informed investment or operational decisions.

Competitive Edge

Stay ahead in the competitive real estate market by leveraging this tool to anticipate changes, adapt strategies, and capitalize on emerging opportunities before others.

Holistic Market Overview

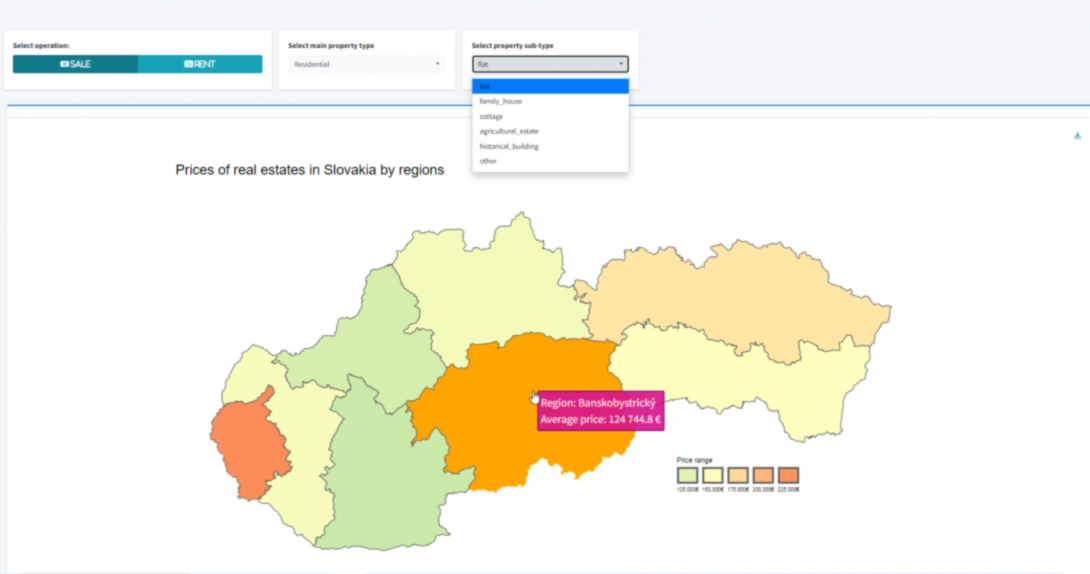
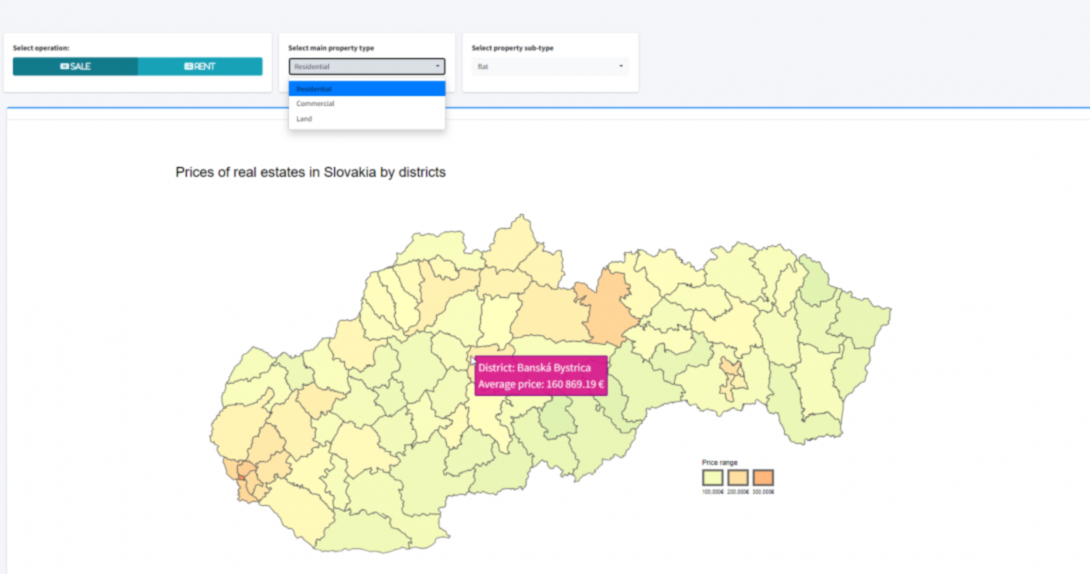
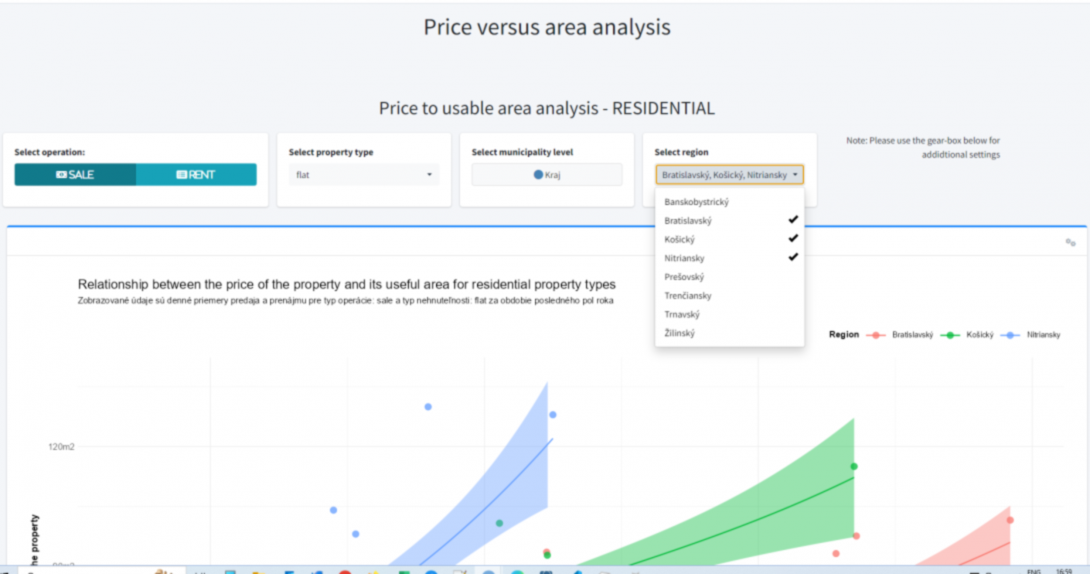
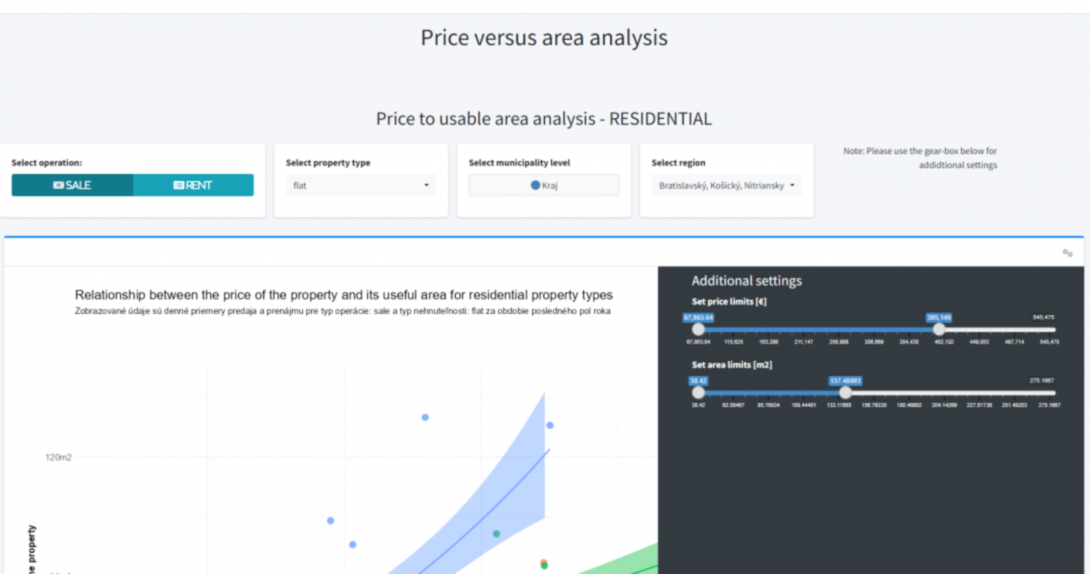
Access a diverse range of data visualizations, charts, and tables, providing a comprehensive and detailed view of various facets of the real estate market in Slovakia.

Empower Informed Decisions

Whether for buying, selling, investing, or strategizing within the real estate sector, this tool equips you with the necessary information to make confident, informed decisions.

User-Friendly Interface

The platform offers an intuitive and user-friendly interface, making it accessible to both seasoned experts and those new to the real estate landscape, ensuring easy navigation and understanding.

Regular Updates

Benefit from weekly updates sourced from diverse public data, ensuring you always have the most current information at your fingertips, crucial in a dynamic market.

Essential for Professionals

A must-have for real estate agents, investors, developers, and anyone engaged in the Slovak real estate market, ensuring a competitive edge and informed decision-making.

Time-Efficient Solution

Save time on extensive market research by having all the pertinent data and insights conveniently aggregated and presented in one location.

Buy this product

Analýza Slovenského trhu nehnuteľnotí
Slovak real-estate market overview and monitoring, subscription for 1 year

Unlock the keys to Slovakia's real estate market evolution—gain access to invaluable insights and informed decision-making with our dynamic, regularly updated dashboard.

introductory price

€149.00

Not convinced yet? Here are some more details

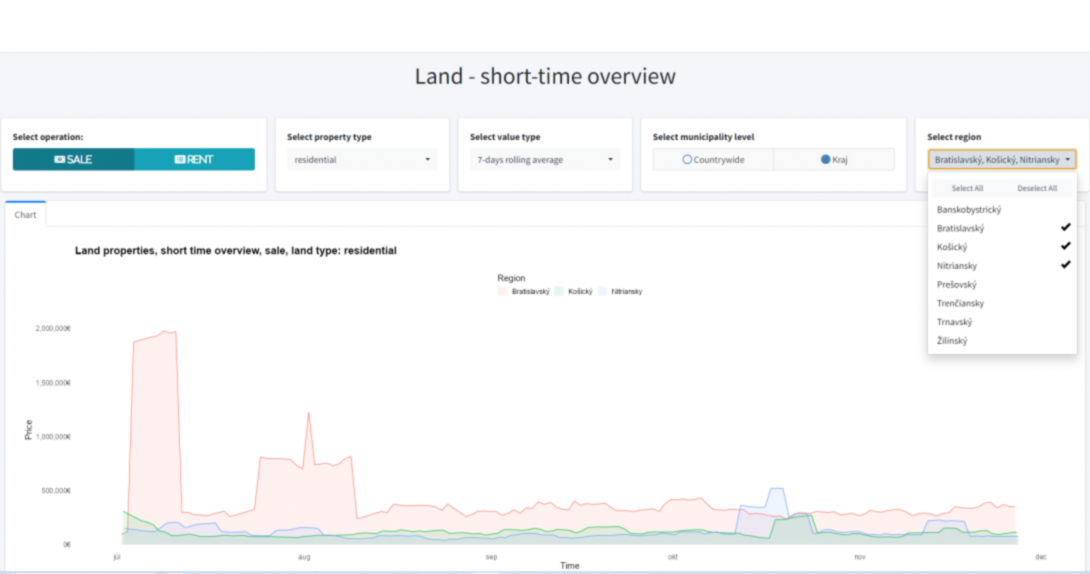
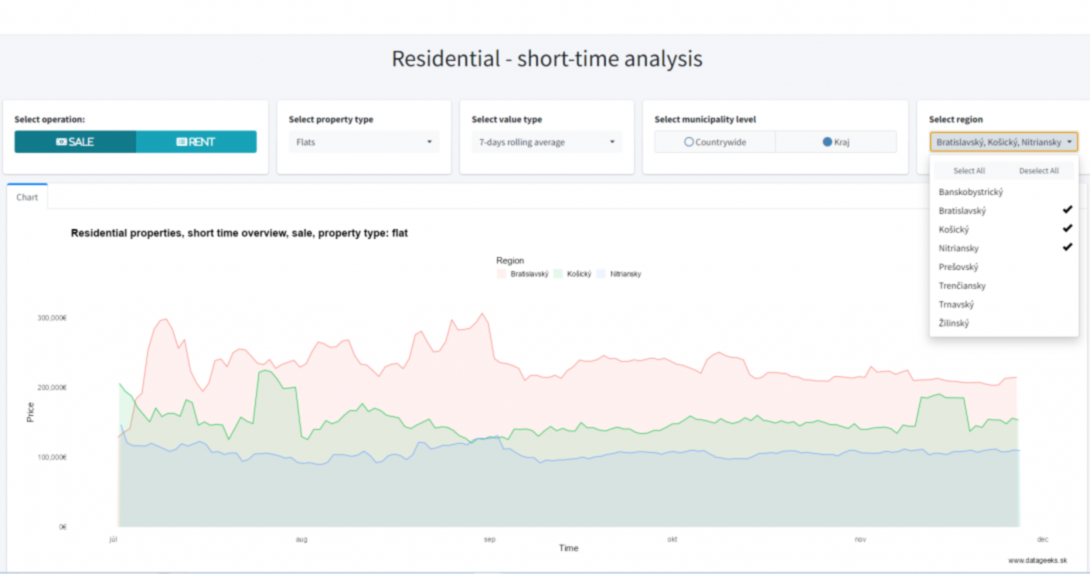
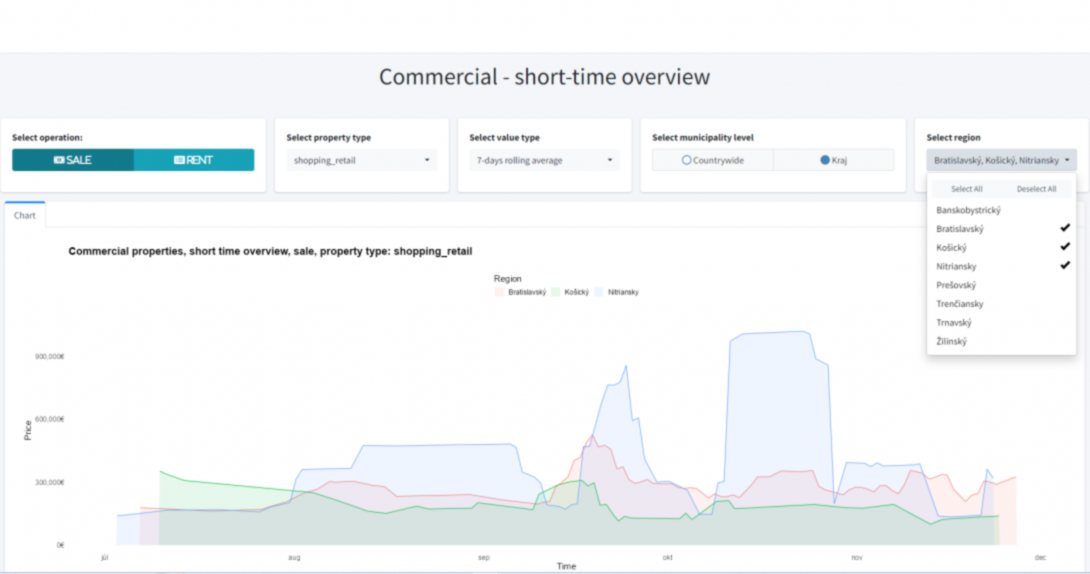
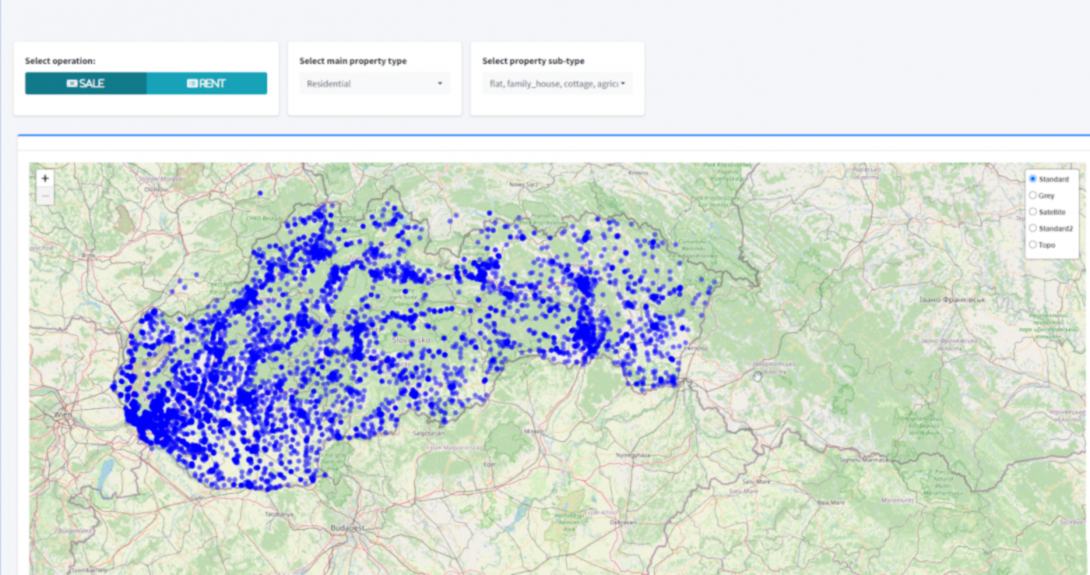
This digital product is an expansive and meticulously curated market overview of the vibrant Slovak real estate realm. It meticulously collates and analyzes data from a diverse range of publicly available sources across the internet, synthesizing this wealth of information into a sophisticated, interactive dashboard. This innovative platform offers a comprehensive landscape through a diverse array of charts, plots, diagrams, and tables, providing a multifaceted view of the real estate market.

Updated at a consistent weekly cadence, this tool serves as a robust monitoring apparatus, catering primarily to professionals entrenched in the dynamic real estate sector. Its core strength lies in its ability to offer detailed insights into the ebb and flow of market trends, presenting a comprehensive picture of current property prices across various types and regions within Slovakia.

Beyond its informational prowess, this digital solution acts as an invaluable compass, equipping industry experts with the necessary tools to navigate the ever-evolving real estate terrain. It enables astute decision-making, leveraging up-to-date data to empower users with actionable insights and strategic foresight.

Designed with a user-centric approach, this platform ensures accessibility, ease of navigation, and a user-friendly interface, making it an indispensable asset for anyone seeking a deeper understanding of Slovakia's real estate landscape. Its mission is clear: to empower professionals with the depth of insights essential for making informed, strategic decisions in a competitive market environment.

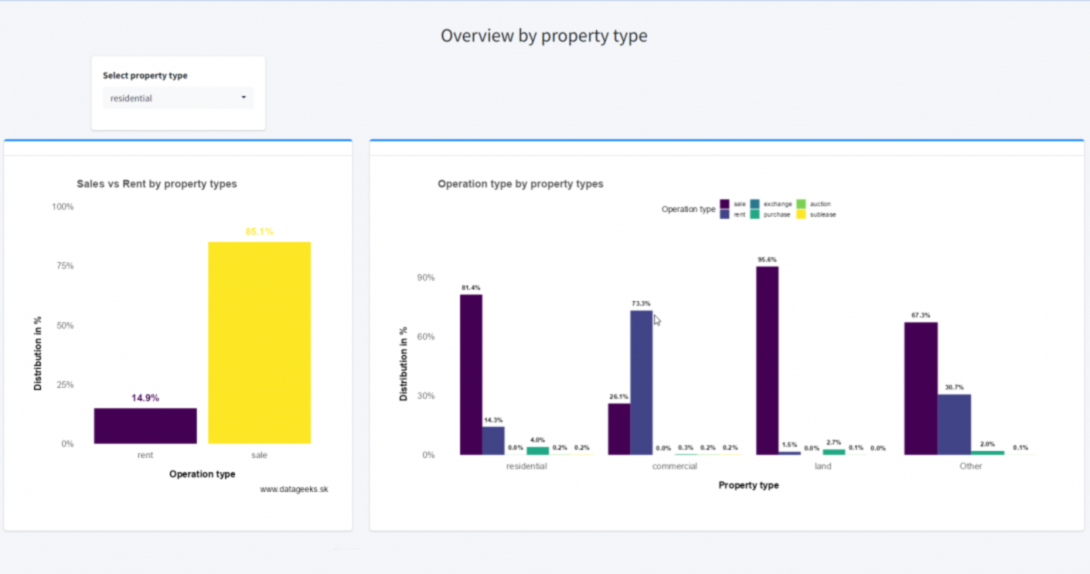
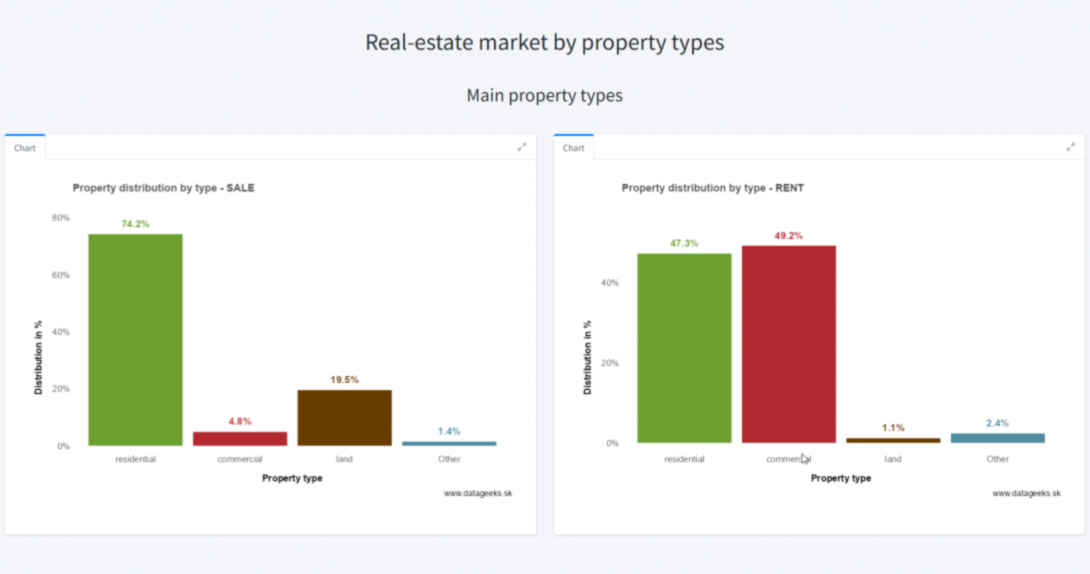
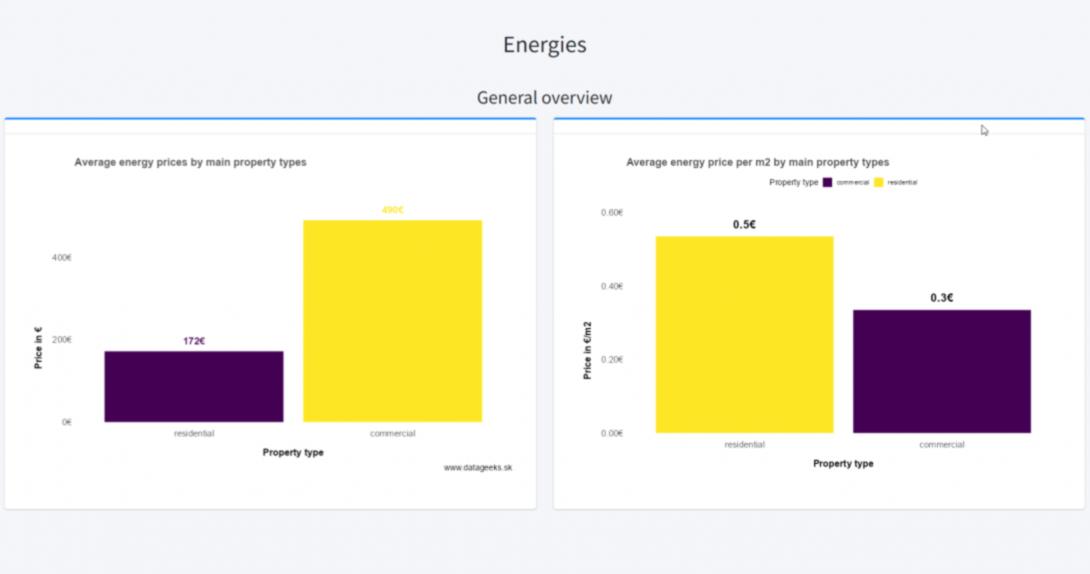
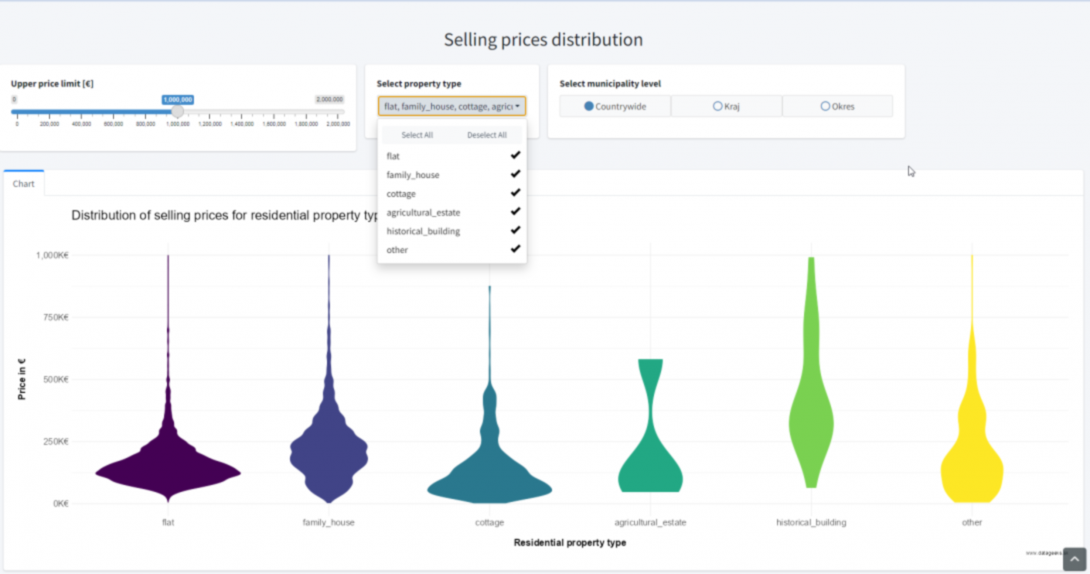
Content of the product Main sections and their content

Below is a non-exhaustive list of product contents

General

Main charts and section description

In this section we provide several general and countrywide insights into the real-estate market. Currently we provide the following charts:

  1. Property types distribution. The charts show the distribution of individual types of real-estate, how they are represented as a percentage of business operations on the market:
    1. Main property types - sale
    2. Main property types - rent
    3. Property sub-types - sale
    4. Property sub-types  - rent
  2. Operation type distribution. The charts show the distribution of individual types of business operations on the market, how they are distributed among each-other and attention is paid to the far most dominant operations - to sale and rent. Currently the following charts are provided:
    1. Operation types distribution on the market how they are represented by commercial ads. Sales, rent, purchase, auction, sublease and exchange and their distribution in percentage
    2. Comparison of sales and rent in percentage
    3. Overview by property types. Which operation types are represented for individual property types. 
  3. Ownership type. Overview of ownership type (corporate, personal) and their representation for for each property type
  4.  Energies. A very basic overview of prices for main property types.

Residential property types

Main charts and section description
  1. Residential property selling prices, price distribution by property types. Data can be filtered out by regions, districts or displayed countrywide. Price limit can be set to better analyze the chart shape.
  2. Residential property rental prices, rental price distribution by property types. Data can be filtered out by regions, districts or displayed countrywide. Price limit can be set to better analyze the chart shape.
  3. Flats by rooms. Analysis of flats divided by number of rooms into the following groups: 1 room, 2 rooms, 3 rooms, 4 rooms and 5 and more rooms. Data can be filtered out by regions, districts or countrywide, as well as by operation type - sale and rent. The following charts are available: 
    1. distribution of flats in percentage, 
    2. average selling price, 
    3. average selling price per m2
    4. average living area.
  4. Flats by selling price. Flats are divided into price-range groups: 0-50k€, 51-100k€, 101-150k€, 151-200k€, 201-300k€, 301-500k€ and above 500k€. Data can be filtered out by regions, districts or countrywide. The following charts are available: 
    1. distribution of flats in percentage,
    2.  average selling price, 
    3. average selling price per m2
    4. average living area. 
  5. Flats by rental price. Flats are divided into monthly payment price-range groups: 0-300€, 301-500€, 501-750€, 751-1000€, 1001-2000€, 2001-5000€ and above 5000€. Data can be filtered out by regions, districts or countrywide. The following charts are available: 
    1. distribution of flats in percentage,
    2. average selling price,
    3. average selling price per m2
    4. average living area.  
  6. Flats by living area. Flats are divided into groups by living area size: 0-20m2, 21-40m2, 41-60m2, 61-80m2, 81-100m2 and above 100m2. Data can be filtered out by regions, districts or countrywide, as well as by operation type - sale and rent. The following charts are available: 
    1. distribution of flats in percentage,
    2. average selling price,
    3. average selling price per m2
    4. average living area. 
  7. Houses by rooms. Analyzing houses divided by number of rooms into the following groups: 1 room, 2 rooms, 3 rooms, 4 rooms and 5 and more rooms. Data can be filtered out by regions, districts or countrywide, as well as by operation type - sale and rent. The following charts are available: 
    1. distribution of houses in percentage, 
    2. average selling price, 
    3. average selling price per m2
    4. average living area,
    5. average land area.
  8. Houses by selling price. Houses are divided into price-range groups: 0-50k€, 51-100k€, 101-150k€, 151-200k€, 201-300k€, 301-500k€ and above 500k€. Data can be filtered out by regions, districts or countrywide. The following charts are available: 
    1. distribution of houses in percentage,
    2.  average selling price, 
    3. average selling price per m2
    4. average living area,
    5. average land area. 
  9. Houses by rental price. Houses are divided into monthly payment price-range groups: 0-300€, 301-500€, 501-750€, 751-1000€, 1001-2000€, 2001-5000€ and above 5000€. Data can be filtered out by regions, districts or countrywide. The following charts are available: 
    1. distribution of houses in percentage,
    2. average selling price,
    3. average selling price per m2
    4. average living area,
    5. average land area.  
  10. Houses by living area. Houses are divided into groups by living area size: 0-50m2, 51-100m2, 101-150m2, 151-200m2, 201-300m2 and above 300m2. Data can be filtered out by regions, districts or countrywide, as well as by operation type - sale and rent. The following charts are available: 
    1. distribution of houses in percentage,
    2. average selling price,
    3. average selling price per m2
    4. average living area,
    5. average land area. 
  11. Houses by land area. Houses are divided into groups by land area size: 0-500m2, 501-1000m2, 1001-1500m2, 1501-2000m2, 2001-5000m2 and above 5000m2. Data can be filtered out by regions, districts or countrywide, as well as by operation type - sale and rent. The following charts are available: 
    1. distribution of houses in percentage,
    2. average selling price,
    3. average selling price per m2
    4. average living area,
    5. average land area.
  12. Other residential property types. Less frequent property types like cottage, agricultural estate or historical building are currently visualized only on the basis of usable area size, divided into following ranges:  0-50m2, 51-100m2, 101-250m2, 251-500m2, 501-1000m2, 1001-5000m2 and above 5000m2. We plan to implement in the future also charts based on other variable. Data can be filtered out by regions, districts or countrywide, as well as by operation type - sale and rent. Please also note, that because these property types are less frequent, we do not have sufficient underlying data for all property types and for all municipality segments. The following charts are currently available: 
    1. average selling price for cottage, agricultural estate, historical building and "Other" estate types
    2. average selling price  per m2 for cottage, agricultural estate, historical building and "Other" estate types
    3. distribution of occurrence  for cottage, agricultural estate, historical building and "Other" estate types
  13. Energy prices. Monthly energy prices for all residential property types. Data can be filtered out by regions, districts or countrywide. The following charts are currently available: 
    1. average monthly energy prices
    2. average monthly energy prices per m2

Commercial property types

Main charts
  1. Commercial property selling prices, price distribution by property types. Data can be filtered out by regions, districts or displayed countrywide. Price limit can be set to better analyze the chart shape.
  2. Commercial property rental prices, rental price distribution by property types. Data can be filtered out by regions, districts or displayed countrywide. Price limit can be set to better analyze the chart shape.
  3. Offices by usable area size. Analysis of offices by usable area size divided into the following groups: 0-50m2, 51-100m2, 101-250m2, 251-500m2, 501-1000m2, 1001-5000m2 and above 5000m2. Data can be filtered out by regions, districts or countrywide, as well as by operation type - sale and rent. The following charts are currently available: 
    1. average selling price, 
    2. average selling price per m2
    3. distribution of occurrence of usable area sizes.
  4. Warehouses by usable area size. Analysis of warehouses by usable area size divided into the following groups: 0-50m2, 51-100m2, 101-250m2, 251-500m2, 501-1000m2, 1001-5000m2 and above 5000m2. Data can be filtered out by regions, districts or countrywide, as well as by operation type - sale and rent. The following charts are currently available: 
    1. average selling price, 
    2. average selling price per m2
    3. distribution of occurrence of usable area sizes.
  5. Shopping and retail premises by usable area size. Analysis of shopping & retail by usable area size divided into the following groups: 0-50m2, 51-100m2, 101-250m2, 251-500m2, 501-1000m2, 1001-5000m2 and above 5000m2. Data can be filtered out by regions, districts or countrywide, as well as by operation type - sale and rent. The following charts are currently available: 
    1. average selling price, 
    2. average selling price per m2
    3. distribution of occurrence of usable area sizes.
  6. Industrial premises by usable area size. Analysis of industrial premises by usable area size divided into the following groups: 0-50m2, 51-100m2, 101-250m2, 251-500m2, 501-1000m2, 1001-5000m2 and above 5000m2. Data can be filtered out by regions, districts or countrywide, as well as by operation type - sale and rent. The following charts are currently available: 
    1. average selling price, 
    2. average selling price per m2
    3. distribution of occurrence of usable area sizes.
  7. Hospitality premises by usable area size. Analysis of hospitality premises by usable area size divided into the following groups: 0-50m2, 51-100m2, 101-250m2, 251-500m2, 501-1000m2, 1001-5000m2 and above 5000m2. Data can be filtered out by regions, districts or countrywide, as well as by operation type - sale and rent. The following charts are currently available: 
    1. average selling price, 
    2. average selling price per m2
    3. distribution of occurrence of usable area sizes.
  8. Other commercial property types. Less frequent property types like agricultural estates, restaurants and "other" commercial property types are visualized here on the basis of usable area size, divided into following ranges:  0-50m2, 51-100m2, 101-250m2, 251-500m2, 501-1000m2, 1001-5000m2 and above 5000m2. Data can be filtered out by regions, districts or countrywide, as well as by operation type - sale and rent. The following charts are currently available: 
    1. average selling price for agricultural estates, restaurants and "other" commercial property types
    2. average selling price per m2 for agricultural estates, restaurants and "other" commercial property types
    3. distribution of occurrence for agricultural estates, restaurants and "other" commercial property types
  9. Energy prices. Monthly energy prices for all commercial property types. Data can be filtered out by regions, districts or countrywide. The following charts are currently available: 
    1. average monthly energy prices
    2. average monthly energy prices per m2

Note: in the foreseen future we will implement more visualizations to analyze commercial real-estate types in even more details. 

Land property types

Main charts
  1. Land property selling prices, price distribution by property types. Data can be filtered out by regions, districts or displayed countrywide. Price limit can be set to better analyze the chart shape.
  2. Land property rental prices, rental price distribution by property types. Data can be filtered out by regions, districts or displayed countrywide. Price limit can be set to better analyze the chart shape.
  3. Residential land by area size. Analysis of residential land by usable area size divided into the following groups: 0-500m2, 501-1000m2, 1001-2000m2, 2001-3000m2, 3001-4000m2, 4001-5000m2 and above 5000m2. Data can be filtered out by regions, districts or countrywide, as well as by operation type - sale and rent. The following charts are currently available: 
    1. average selling price, 
    2. average selling price per m2
    3. distribution of occurrence of usable area sizes.
  4. Commercial land by area size. Analysis of commercial land by area size divided into the following groups: 0-500m2, 501-1000m2, 1001-2000m2, 2001-3000m2, 3001-4000m2, 4001-5000m2 and above 5000m2. Data can be filtered out by regions, districts or countrywide, as well as by operation type - sale and rent. The following charts are currently available: 
    1. average selling price, 
    2. average selling price per m2
    3. distribution of occurrence of usable area sizes.
  5. Arable land by area size. Analysis of arable land by area size divided into the following groups: 0-500m2, 501-1000m2, 1001-2000m2, 2001-3000m2, 3001-4000m2, 4001-5000m2 and above 5000m2. Data can be filtered out by regions, districts or countrywide, as well as by operation type - sale and rent. The following charts are currently available: 
    1. average selling price, 
    2. average selling price per m2
    3. distribution of occurrence of usable area sizes.
  6. Industrial land by area size. Analysis of industrial land by area size divided into the following groups: 0-500m2, 501-1000m2, 1001-2000m2, 2001-3000m2, 3001-4000m2, 4001-5000m2 and above 5000m2. Data can be filtered out by regions, districts or countrywide, as well as by operation type - sale and rent. The following charts are currently available: 
    1. average selling price, 
    2. average selling price per m2
    3. distribution of occurrence of usable area sizes.
  7. Other land types. Less frequent land property types like forest, garden, meadow & grassland, vineyard, water area and "other" land types are visualized here on the basis of usable area size, divided into following ranges: 0-500m2, 501-1000m2, 1001-2000m2, 2001-3000m2, 3001-4000m2, 4001-5000m2 and above 5000m2. Data can be filtered out by regions, districts or countrywide, as well as by operation type - sale and rent. The following charts are currently available: 
    1. average selling price for forest, garden, meadow & grassland, vineyard, water area and "other" land types
    2. average selling price per m2 for forest, garden, meadow & grassland, vineyard, water area and "other" land types
    3. distribution of occurrence for forest, garden, meadow & grassland, vineyard, water area and "other" land types

Note: in the foreseen future we will implement more visualizations to analyze different types of land in even more details. 

Short-time overview

Main charts

In this section we provide a short-term time-based charts within our real estate market overview—an invaluable tool offering concise snapshots of rapidly evolving market trends, empowering users with crucial for timely decision-making.  Visualizations are based on data approximately up to 6 months old and currently we provide the following charts:

  1. Residential properties short-time overview. Average sales and rental prices for selected property sub-types, actual values or 7-days rolling average, countrywide or filtered by regions.
  2. Commercial properties short-time overview. Average sales and rental prices for selected property sub-types, actual values or 7-days rolling average, countrywide or filtered by regions.
  3. Land properties short-time overview. Average sales and rental prices for selected property sub-types, actual values or 7-days rolling average, countrywide or filtered by regions.

Maps

Main charts

Our intention in this section is to provide visualization of real-estate data on maps. It offers a spatial representation of property-related information, presenting insights in a geographical context.  We currently offer the following maps:

  1. Map showing the distribution of main property types among the country. On several layers types (including the orthophoto) we display property metrics, trends, and market dynamics in a visually intuitive manner directly linked to geographic locations.
  2. Choropleth map. Our intention is to provide a clear visual representation of data variations across geographic areas, enabling quick comparisons of real estate metrics (like property prices) within distinct regions, offering insights into localized trends and disparities in a comprehensive, easy-to-understand format. We are currently providing metrics  average selling prices and average rental prices across the following municipality segments: 
    1. regions
    2. districts

Analysis

Main charts

In this section we are analyzing various factors influencing property values, demand, and trends in order to understand the current and future conditions of the real estate market. This analysis helps stakeholders—such as investors, developers, agents, and policymakers - make informed decisions regarding buying, selling, investing, or developing properties. Currently we are offering the following analysis:

  1. Price vs area analysis. Interactive charts show relationship between price and area for different regions and different property types. User can select to display selling price or rental price, property type and region. On the sidebar user can adjust both, the x (property area size) and y (property price) axis and zoom to desired ranges. There are currently three charts of this type created, each for main property type:
    1. residential properties
    2. commercial properties
    3. land 

Note: we are preparing more chart types to analyze also other real-estate metrics. 

Buy this product

Analýza Slovenského trhu nehnuteľnotí
Slovak real-estate market overview and monitoring, subscription for 1 year

Unlock the keys to Slovakia's real estate market evolution—gain access to invaluable insights and informed decision-making with our dynamic, regularly updated dashboard.

introductory price

€149.00