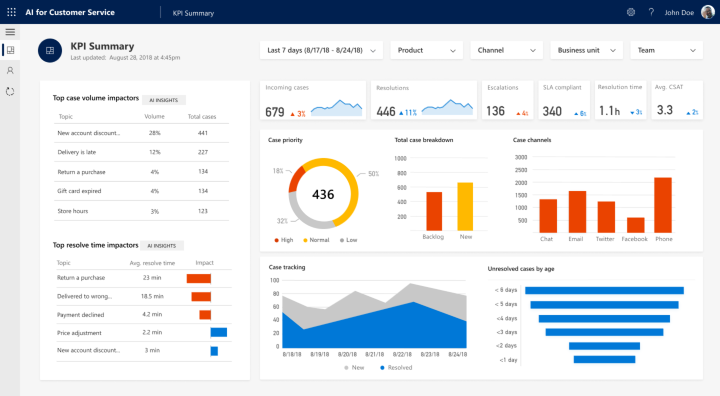
Data visualization via interactive dashboards
Unleash the Power of Data
Wondering how more data can benefit your business? Gain a competitive edge by unlocking deeper insights into your operations. At DataGeeks we understand that raw data is just the beginning. Our data visualization services empower you to transform complex datasets into clear, compelling visual narratives that drive informed decision-making. From informed decision-making to discovering new opportunities, our data solutions empower you to stay ahead in a rapidly evolving market. Elevate your business strategy with the clarity that comes from a wealth of data at your fingertips.
OUR CAPABILITIES
Shiny Framework
Our interactive dashboards are crafted using the Shiny framework, offering a seamless and engaging user experience
Dynamic Charts and Tables
From dynamic charts that respond to user input to interactive tables, our dashboards are designed to transform raw data into actionable insights
Engaging Presentations
Impress your clients and stakeholders with visually stunning presentations that communicate your data story effectively
Benefits of Data Insights
Wondering how more data can benefit your business? Here are the tangible benefits of leveraging data insights:

Informed Decision-Making
Make strategic decisions based on accurate, real-time data, enhancing your ability to respond to market changes.

Engagement and Impact
Interactive data visualizations engage users, encouraging exploration and interaction with the data.
Operational Efficiency
Streamline your internal processes and enhance efficiency by using data to identify areas for improvement.

Competitive Advantage
Stay ahead of the competition by leveraging data to anticipate market trends and customer preferences.

Clarity and Understanding:
Data visualization translates complex data into visually appealing and easy-to-understand formats like charts, graphs, and maps. This clarity fosters a deeper understanding of information, making it accessible to a wider audience.
Identify Opportunities
Visualizing data helps in spotting emerging trends or identifying opportunities that might have gone unnoticed in raw datasets. This allows for proactive action and a competitive edge in the market.

Efficient Communication
Visualizations serve as a universal language for data, facilitating more efficient communication across teams and stakeholders. They enable the sharing of insights and ideas in a format that is easily comprehensible and engaging.